
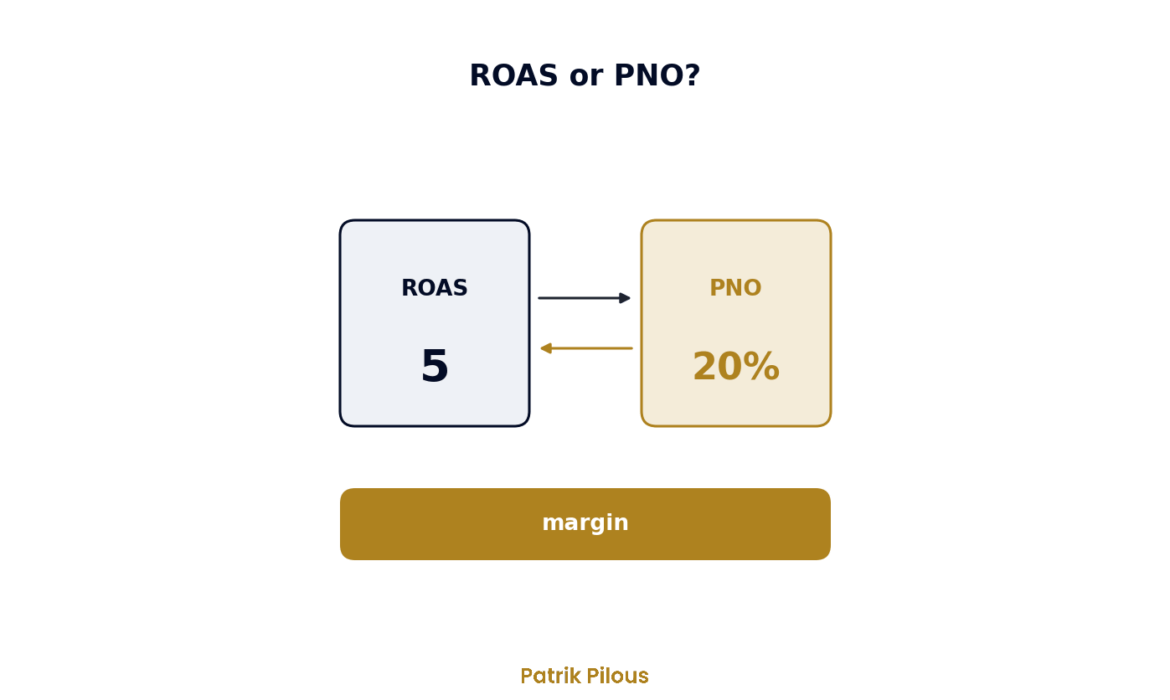
ROAS (return on ad spend) is the ratio of ad revenue to ad cost. A campaign that spends 10,000 CZK (about 410 EUR) and brings in orders worth 50,000 CZK (about 2,100 EUR) (both excluding VAT) has a ROAS of 5, shown in Google Ads as 500%. PNO (podíl nákladů na obratu, ad cost as a share of revenue) is the same number turned upside down, so 10,000 divided by 50,000, which comes to 20%. Neither of them tells you whether the advertising makes money, though. You only find that out once you put your margin next to it.
You can steer by either of them, as long as you know your break-even point and derive your target from it. Below you will find how to calculate the break-even point, why a new customer can justify a higher PNO than a returning one and why brand campaigns look better than they really are.
How ROAS and PNO are calculated
ROAS is the revenue attributed to advertising divided by the ad cost. In its help article on target ROAS, Google works through an example where you want 5 dollars of conversion value for every dollar spent on ads, so the target ROAS is 500%.
PNO is calculated as ad cost divided by revenue, multiplied by 100. It is a Czech convention used by Sklik (the ad platform of Seznam, the Czech search engine) and most Czech agencies. Converting between the two numbers is simple.
| ROAS | ROAS in Google Ads | PNO |
|---|---|---|
| 2 | 200 % | 50 % |
| 4 | 400 % | 25 % |
| 5 | 500 % | 20 % |
| 10 | 1 000 % | 10 % |
PNO as a percentage is 100 divided by ROAS, and ROAS is 100 divided by PNO as a percentage. A higher ROAS and a lower PNO mean the same thing: each crown spent on ads brought in more revenue. If one agency reports a ROAS of 5 and another a PNO of 20%, you are looking at the same result twice.
Why neither number tells you whether advertising makes money
Both metrics work with revenue, but as an owner you care about what is left over. ROAS and PNO miss above all these four things: three costs and one future value.
- Margin. Revenue of 50,000 CZK (about 2,100 EUR) brings only 7,500 CZK (about 310 EUR) at a 15% margin, but 25,000 CZK (about 1,000 EUR) at a 50% margin.
- Returned goods. The conversion is counted on the day of the order. The ad report usually will not show that half the shoes were sent back.
- VAT. The tracking code often sends the order value including VAT, while ad costs exclude VAT. At a 21% rate, a ROAS of 6 including VAT is only 4.96 excluding VAT, and PNO rises from 16.7% to 20.2%.
- Customer value over time. A new customer’s first order can make a loss and still pay off, because the customer comes back. ROAS from a single order cannot see that.
That is why you should check with your agency exactly what it sends as the conversion value. In its help article on conversion values, Google itself states that the value can be either sales revenue or margin. Whether it includes VAT or not, and whether it includes shipping and discounts, is decided by the online shop, not by Google.
Break-even point based on margin
Advertising breaks even exactly when its cost swallows the entire margin from the orders it brought in. That gives you a simple rule. Break-even PNO equals gross margin as a percentage. Break-even ROAS is 1 divided by the margin. This only holds when you calculate both revenue and margin excluding VAT. If your agency reports PNO from revenue including VAT, the break-even point is roughly a sixth lower, at a 25% margin about 20.7%.
By margin I mean revenue excluding VAT minus the costs that arise with every order: the purchase price of the goods, shipping, packaging, payment fees and average returns. Fixed costs such as rent do not belong here. And do not confuse margin with markup: goods bought for 100 CZK (about 4.1 EUR) and sold for 125 CZK (about 5.1 EUR) excluding VAT have a 25% markup, but only a 20% margin.
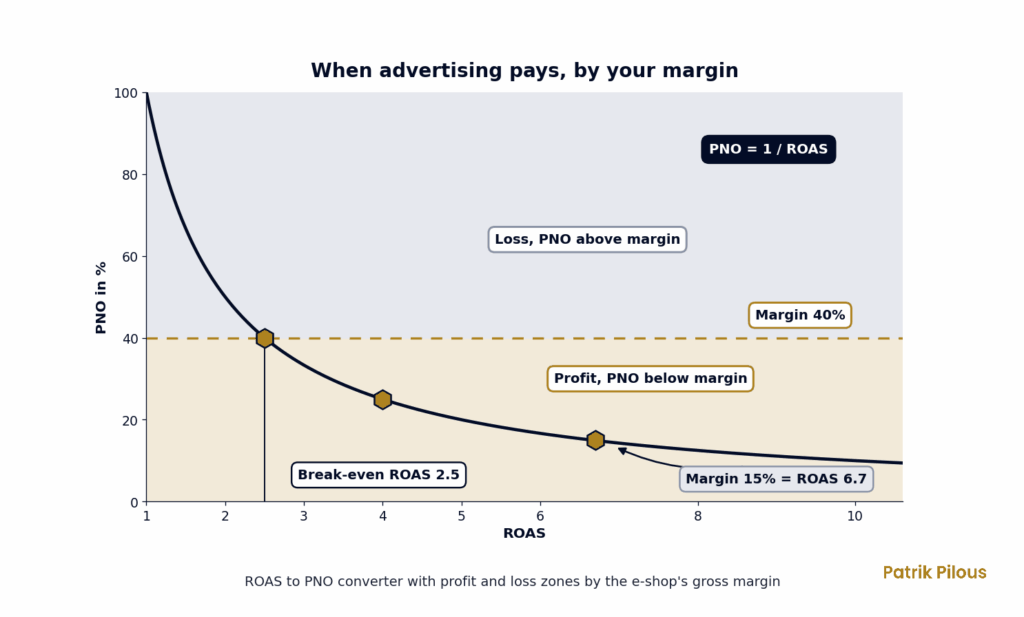
| Gross margin | Break-even PNO | Break-even ROAS | What it means |
|---|---|---|---|
| 15 % | 15 % | 6,7 (667 %) | electronics, even ROAS 6 loses money |
| 25 % | 25 % | 4 (400 %) | standard range with competition |
| 40 % | 40 % | 2,5 (250 %) | accessories, cosmetics, fashion |
| 60 % | 60 % | 1,7 (167 %) | own production and own brand |
The break-even point is not a target, though. At zero after advertising, an online shop earns nothing towards stock, wages, rent or its own profit. Your target PNO is therefore the margin minus the percentage points of revenue that should be left after advertising for fixed costs and profit. With a 40% margin and a requirement that 15% of revenue excluding VAT remains after advertising, the target PNO comes out at 25%, which is a ROAS of 4.
Three campaigns with the same ROAS and different profit
A model scenario. An online shop runs three campaigns, each costs 100,000 CZK (about 4,100 EUR) a month and each brings in orders worth 500,000 CZK (about 21,000 EUR) excluding VAT. ROAS is 5 for all of them and PNO 20%. The margin already includes all per-order costs, so profit after advertising is the amount before fixed costs. In the report, the campaigns look like triplets.
| Campaign | Margin | Revenue excl. VAT | Gross profit | Ad cost | Profit after advertising | POAS |
|---|---|---|---|---|---|---|
| Electronics | 15 % | 500,000 CZK (about 21,000 EUR) | 75,000 CZK (about 3,100 EUR) | 100,000 CZK (about 4,100 EUR) | −25,000 CZK (about 1,000 EUR) | 0,75 |
| Accessories | 30 % | 500,000 CZK (about 21,000 EUR) | 150,000 CZK (about 6,200 EUR) | 100,000 CZK (about 4,100 EUR) | 50,000 CZK (about 2,100 EUR) | 1,5 |
| Own brand | 50 % | 500,000 CZK (about 21,000 EUR) | 250,000 CZK (about 10,000 EUR) | 100,000 CZK (about 4,100 EUR) | 150,000 CZK (about 6,200 EUR) | 2,5 |
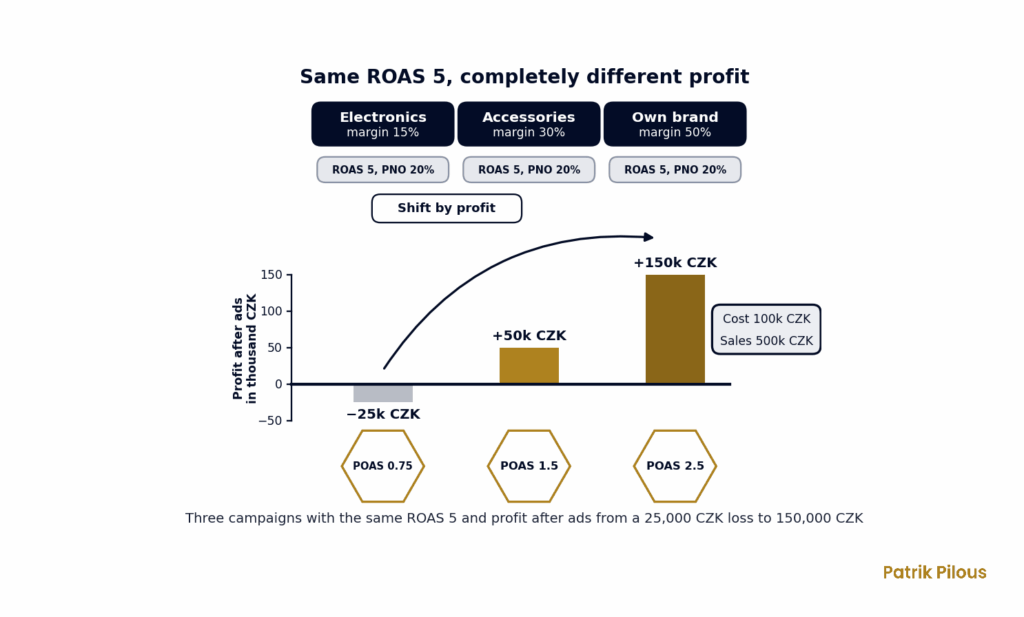
Electronics loses 25,000 CZK (about 1,000 EUR) a month with the same ROAS as the most profitable campaign. If you only look at ROAS, you will not notice the difference. Going by profit, the money would go to the own brand, where each crown of advertising returns 2.50 CZK (about 0.1 EUR) of margin.
The same thing happens inside a single campaign, because a performance campaign with one target ROAS for the whole range optimises conversion value, and when that value is revenue, it knows nothing about the different profitability of products and will happily spend more on low-margin goods. It helps to split your range into campaigns by margin, or to send the margin itself as the conversion value.
Target PNO for new and returning customers
A new customer has a different value from one who is buying from you for the third time. The first brings the first order and all the ones that follow, while the second would make some purchases even without advertising. A single PNO for both groups therefore either overpays for existing customers or chokes growth.
A model example. The first order averages 1,500 CZK (about 62 EUR) excluding VAT, which at a 40% margin brings 600 CZK (about 25 EUR) of gross profit. If a new customer places one more order of the same size within 12 months (an assumption you should check in your own data), they bring 1,200 CZK (about 49 EUR) in a year. If you are willing to pay half of that annual value to acquire them, so 600 CZK (about 25 EUR), the PNO on the first order can reach 40%. For returning customers a lower PNO is enough, in this model say 15%, but the exact number should come from an incrementality test.
More in the articles on CLV and on how to put together a marketing strategy.
Google Ads can turn this into bids. In its help article on customer lifecycle goals, it describes a mode that bids more for new customers than for existing ones, and the condition is value-based bidding, meaning target ROAS or maximise conversion value. The system recognises existing customers automatically from conversions, or more precisely from the customer list you upload to it.
POAS shows profit instead of revenue
POAS (profit on ad spend) is the margin in crowns from orders attributed to advertising divided by ad cost. When the margin includes all per-order costs, its break-even point is 1 regardless of your product range. In the table of three campaigns, it is the last column, and it reveals at first glance which campaign is losing money.
Technically, you can get to POAS in two ways. The first is reporting: Google Ads shows gross profit when you add the cost_of_goods_sold attribute to your product feed in Merchant Center, usually through a supplemental feed, which a developer often helps with. The second is tracking, where the conversion code sends margin instead of revenue as the value. Only then does the target ROAS in your account actually steer POAS. The catch is in the data. Purchase prices change, and if you do not keep them up to date in your online shop, you get a POAS that looks good and is wrong.
Brand and remarketing inflate ROAS
A campaign on your own company name has ideal conditions for a high ROAS. Someone typing the name of your online shop into Google wants to come to you and would often come through the organic result anyway, but the ad takes credit for the order. Remarketing to people with a full basket works in a similar way.
The best-known illustration is the eBay experiment. In 2012 the company switched off ads on queries containing “ebay” on the Yahoo! and MSN search engines, and 99.5% of the clicks it lost immediately moved to the organic results. For non-brand queries, the experiment found a short-term return on investment of −63%, while the usual calculation from data without a control group showed over 1,400% (with controls for time and region) and over 4,100% without them.
“Advertising on brand keywords has no measurable short-term benefit.”
Thomas Blake, Chris Nosko and Steven Tadelis, Consumer Heterogeneity and Paid Search Effectiveness, Econometrica, 2015
Sinan Aral of MIT cites the same study in Harvard Business Review as evidence that, without the experiment, the effectiveness of eBay’s advertising was overestimated by up to 4,100%. According to the study, most of the money went on clicks from frequent customers who would have bought anyway, while the advertising really worked mainly on new customers and on those who bought from eBay only occasionally.
I do not recommend switching brand campaigns off blindly, though. A study by Andrey Simonov, Chris Nosko and Justin Rao in Marketing Science, based on Bing data, showed that when a brand does not advertise on its own name and competitors do, the competitors take 18 to 42% of its clicks. According to the authors, defensive advertising pays off there. What is more, the eBay result cannot be transferred to a smaller Czech online shop.
Only a test will tell you. Switch off the brand campaign, ideally only in some regions, and track the total revenue of your online shop rather than the revenue of the campaign itself. The length of the test depends on order volume and seasonality, and you should set the control group and the metric you track in advance. In Google Search Console you will also see how many clicks on your company name the organic results took over.
Why a control group matters is shown by a study by Brett Gordon and colleagues in Marketing Science. Across 15 experiments on Facebook, methods without random assignment often gave a different result from the experiment.
Which number for which decision
ROAS and PNO are good tools for managing campaigns and poor tools for deciding whether advertising pays off for a company. This is how I divide it.
| Decision | Which number | Why |
|---|---|---|
| Target for automated bidding in Google Ads or Sklik | target ROAS or PNO derived from margin | the system can only manage a ratio it knows |
| Comparing campaigns with the same margin | ROAS or PNO | with the same margin, the ratio is enough |
| Whether advertising makes money overall | profit after advertising, POAS | the only numbers that include margin |
| How much to pay for a new customer | cost per new customer against CLV | the first order is not enough |
| Whether to run brand or remarketing at all | incrementality from a test with a control group | attribution also claims purchases that would have come anyway |
| How much to put into marketing in total | share of all marketing costs in the e-shop’s revenue | includes channels outside ad platforms too |
You will find other metrics in the article Marketing and KPIs. ROAS has one more trap. Once it becomes the only goal, an agency can improve it by moving money into brand and remarketing, where ROAS is high on its own. It is a textbook case of Goodhart’s law.
Where PNO makes sense and where it misleads
PNO is practical where the product range has a similar margin and most orders come from new customers. Then a target PNO is a clear agreement with the agency.
It misleads in five situations: with very different margins across the product range, with brand and remarketing, with a high share of returns, with a long customer decision process, and when the company wants to grow. The lowest PNO does not mean the highest profit.
A model example. A campaign with a 40% margin spends 100,000 CZK (about 4,100 EUR) and brings 1 million CZK (about 41,000 EUR) in revenue, PNO is 10% and profit after advertising is 300,000 CZK (about 12,000 EUR). After the budget rises to 500,000 CZK (about 21,000 EUR), it brings 2.5 million CZK (about 100,000 EUR), PNO rises to 20% and profit after advertising grows to 500,000 CZK (about 21,000 EUR). A worse PNO, 200,000 CZK (about 8,200 EUR) more money. The same principle is shown by Seznam (Czech search engine) on its blog, where a higher cost share brought higher total profit.
Questions to ask your agency
The agency should answer the first four questions without preparation and the last one with data.
| Question | What you want to hear | Warning sign |
|---|---|---|
| Is the conversion value with or without VAT? | a clear answer and how it matches the e-shop | “Google handles that itself” |
| Which margin is our target ROAS derived from? | specific margins by category | “that’s how it usually is in the industry” |
| What share of revenue comes from brand and remarketing? | a number and a plan for an incrementality test | brand is in one ROAS with everything else |
| Do you distinguish between new and returning customers? | a different target or setup for new ones | one ROAS for everything |
| What happens to profit if we add 20% to the budget? | an estimate and a test showing where profit in CZK stops growing | “ROAS will get worse, so we don’t recommend it” with no talk of profit |
The last question is the most important. An agency that judges only by PNO will often reject a budget increase, because additional orders usually cost more. The decision should be based on how much extra profit in CZK they bring.
An ad platform will not set a target PNO based on margin and customer value. It is a decision about the whole company’s budget, which belongs to the role described in the article who a CMO is. You can find how I do this as an outsourced and fractional CMO, from unifying measurement to the brief for PPC suppliers, on the service page.
Interesting questions on the topic
What is PNO?
PNO (podíl nákladů na obratu, ad cost as a share of revenue) shows what percentage of advertising revenue the advertising itself costs. It is calculated as ad costs divided by revenue, multiplied by 100. You will commonly see it in Sklik and in reports from Czech agencies.
How is ROAS calculated?
You divide advertising revenue by its costs. For 20,000 CZK (about 820 EUR) of advertising and 100,000 CZK (about 4,100 EUR) of revenue, ROAS comes out at 5.
What is the formula for converting PNO to ROAS?
PNO in percent is 100 divided by ROAS, and vice versa. A ROAS of 4 corresponds to a PNO of 25%.
What is break-even ROAS?
The ROAS at which advertising uses up the entire margin from orders. It is calculated as 1 divided by the margin, so with a 25% margin it is 4.
What is POAS?
POAS is profit on ad spend, meaning gross profit from orders divided by advertising costs. The break-even point is 1, so campaigns with different margins can be compared side by side.
Euro amounts are approximate, converted at the Czech National Bank rate of 24.34 CZK per EUR on 29 October 2026.

