
Google Search Console, GSC for short, is a free Google tool that shows you how your website looks from the search engine’s point of view. It shows the queries you appear for, clicks, average position and the indexing status of every page. The numbers are measured directly by Google (i.e. first-party data), not estimated by a third-party tool, which is why it is the first access I ask every new client for. You can see how the site is doing on Google and what it ranks for, but also things like manual penalties.
I have used GSC since the very start of my work in SEO and marketing. The role of this tool and its value have not changed much in recent years.
However, it only measures Google’s services: search, plus Discover and Google News (and now AI as well). You won’t find visits from Seznam (Czech search engine), Bing, ChatGPT or Perplexity in it, nor other channels such as email marketing or PPC. Under the headings below you’ll find how to add and verify a site, how Search Console is used in practice and, above all, where the data misleads you or is missing.
From Webmaster Tools to Search Console
The tool was created around 2005 under the name Google Webmaster Tools. In May 2015 Google renamed it Search Console, explaining that it had long been used not only by webmasters but also by business owners, marketers, developers and SEO consultants. That’s where the abbreviation GSC comes from, which has caught on in the industry.
The big turning point came in January 2018, when Google launched a new version of the interface. The Performance report then got 16 months of history, and with it the ability to compare data year on year, which makes more sense for seasonal e-shops than comparing with the previous month. Since 2021 filters have supported regular expressions, and since December 2024 a view of the last 24 hours has been available.
How to add a site to Search Console step by step
You sign in with a regular Google account at search.google.com/search-console. Then you add a so-called property, which in Search Console terms is one website or part of it. You can choose between two types, and the ownership verification differs depending on which you pick.
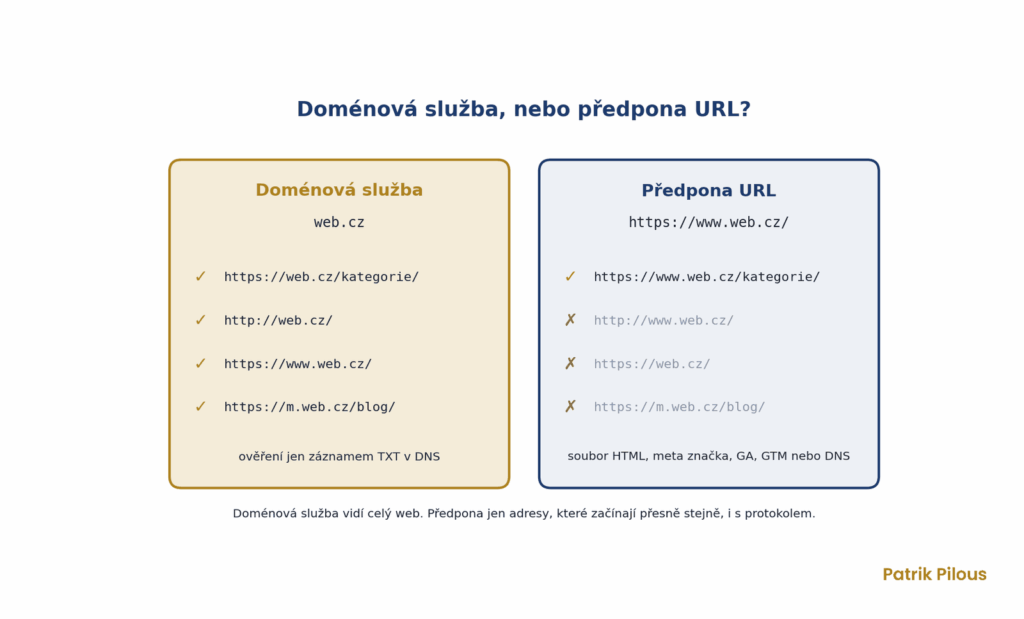
A domain property (for example patrikpilous.cz) covers all subdomains and both protocols, meaning http and https, with and without www. It can only be verified with a TXT record in the DNS at your domain registrar. A URL-prefix property, for example an address starting with https and www, covers only addresses that start with exactly that string, including the protocol. An address on http or on the m. subdomain no longer falls under it.
- Open Search Console and choose Add property from the property menu.
- Choose a domain property if you have access to the DNS. If you don’t, choose URL prefix.
- For a domain, copy the TXT record and add it to your DNS. For a prefix, choose an HTML file, a meta tag, Google Analytics or Google Tag Manager.
- Click Verify. A DNS change sometimes takes a few hours to propagate, so you can postpone verification and finish it later.
- Add your sitemap URL in the Sitemaps section and add other users in Settings.
I always set up a domain property as the main one, alongside URL prefixes for language versions or the blog when I want to track them separately. Child properties are verified automatically once the parent is verified. Incidentally, data starts being collected as soon as you add the property, even before verification. For a brand-new site, though, it can take up to a week before anything shows up in the reports.
One trap I see regularly. Verification is only valid while the verification token stays on the site. During a redesign, a developer deletes the meta tag or the HTML file and the company loses access just when it needs it most. That’s why I always add two verification methods at once, DNS and one other.
What you’ll find in Search Console
The interface is divided into reports, and each answers a different question. I spend most of my time in Performance and Indexing, and I open the rest when something is on fire. These are the seven reports I have actually used over the years.
- Search performance. Clicks, impressions, CTR and average position by query, page, country and device.
- Page indexing. How many URLs are in the index and why the rest are not, with reasons such as duplicates, noindex, 404 errors or crawled, currently not indexed.
- URL Inspection. The status of a single URL, the canonical chosen by Google, a live test and an indexing request.
- Sitemaps. Submitted sitemaps, when Google last read them and how many URLs from them it knows.
- Links. Most linked pages, linking sites and anchor texts. The report is rougher than in Ahrefs, but it comes directly from Google.
- Experience and Core Web Vitals. Page speed and stability based on data from real Chrome users.
- Manual actions and security. A manual penalty from Google or a hacked site. If something shows up here, it takes priority over everything else.
For a beginner, the most important thing is to understand the process behind the numbers. Google first finds and crawls a page, which is called crawling. Then it stores it in the index, see indexing, and only after that can it show it in the results. Search Console shows you where in this sequence a page got stuck.
How I use Search Console in practice
This part is the reason I wrote the article. Most guides stop at describing the menu, but the value of Search Console lies in the questions you ask it. Here are the five I ask most often for clients, in order of how much work they save.
Queries in positions 5 to 15
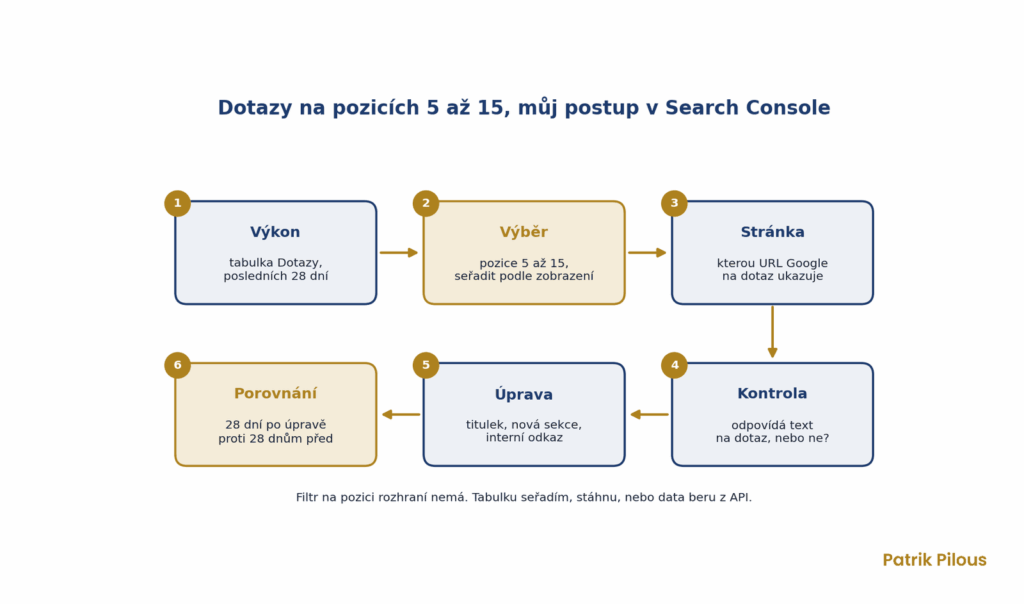
A page with an average position of around ten for a query is usually already associated with the topic by Google. It often needs just a little more, and that tends to be cheaper than writing a new article. This is my working heuristic, not a rule, as an average can hide very different positions. The interface has no position filter, so I sort the query table by position, export it or pull the data from the API, and keep only the rows between positions five and fifteen with a reasonable number of impressions.
For each such query, I then open the target page and check whether it answers it at all. It often turns out that the query barely appears in the text, lacks its own subheading or is overshadowed by another page on the site. Adjusting the title, adding a new section or a stronger internal link are then the first things I try, because I can do them within an hour and see the result within a few weeks.
Comparing two periods
The date tab has a Compare option. I use it in two ways. The last 28 days versus the previous 28 shows whether a specific change worked. A year-on-year comparison of the same month filters out much of the seasonality, so you don’t panic when traffic to an e-shop selling winter footwear drops in summer.
Comparison makes the most sense by page and by query, not just in the overall chart. An overall drop of ten per cent can hide one category that fell by half while the rest of the site grows. Without the breakdown, you would look for the cause in completely the wrong place.
Cannibalisation between two pages
When you filter a single query and switch the table to Pages, you’ll see all the URLs Google showed for that query. Two or three addresses with alternating positions are the typical picture of what is called cannibalisation. Not every case is a problem, but it’s good to see each one.
Checking query by query manually works for a small site. For an e-shop with thousands of products, I pull the data from the API and look for page pairs in bulk, because the interface only shows one query at a time.
Filters with regular expressions
Search Console has supported regex filters since April 2021, and negative matching since June 2021. Google uses RE2 syntax. For me it’s the quickest way to split data into groups that the interface can’t otherwise create. I keep these four expressions saved and use them on almost every site.
- Questions. The expression ^(jak|co|proč|kolik|kde|kdy) filters queries that start with a question word. It shows what your articles and FAQs should answer.
- Brand versus non-brand. An expression with the brand name and its typos, for example pilous|piluos|patrikpilous, with the Doesn’t match option separates out people who already know you.
- Purchase intent. The expression cena|levn|koupit|eshop|akce finds queries close to a purchase.
- Site sections. On pages, the expression /blog/|/clanky/ separates content from categories and products.
Watch out for one thing. As soon as you filter queries, anonymised queries drop out of the numbers. The sum of “matches” and “doesn’t match” will therefore never equal the total in the chart, and this is not a bug in the tool.
Indexing and URL Inspection
I compare the Page indexing report with how many pages the site actually has. When an e-shop sells thousands of products and only a fraction of them are in the index, I first find out which ones are missing and why. If they are categories and products that are meant to sell, I deal with that before creating new content. The most common reasons are duplicates without a correct canonical, parameters from filters and pages that Google crawled but did not consider worth indexing.
For an individual URL, URL Inspection helps. It shows which version of the page Google chose as canonical, when it last crawled it and how it rendered it. The Request indexing button has a daily limit. Google doesn’t publish the exact number, but for me it usually stops working after about ten URLs per property, so I save it for new and substantially rewritten pages. The rest we leave to the sitemap.
Data limits you need to account for
Search Console is the most accurate source of Google search data you have. Even so, the data doesn’t show everything, and anyone who doesn’t know this draws the wrong conclusions from it. These are the limitations I run into most often, and Google itself describes all of them in its help centre.
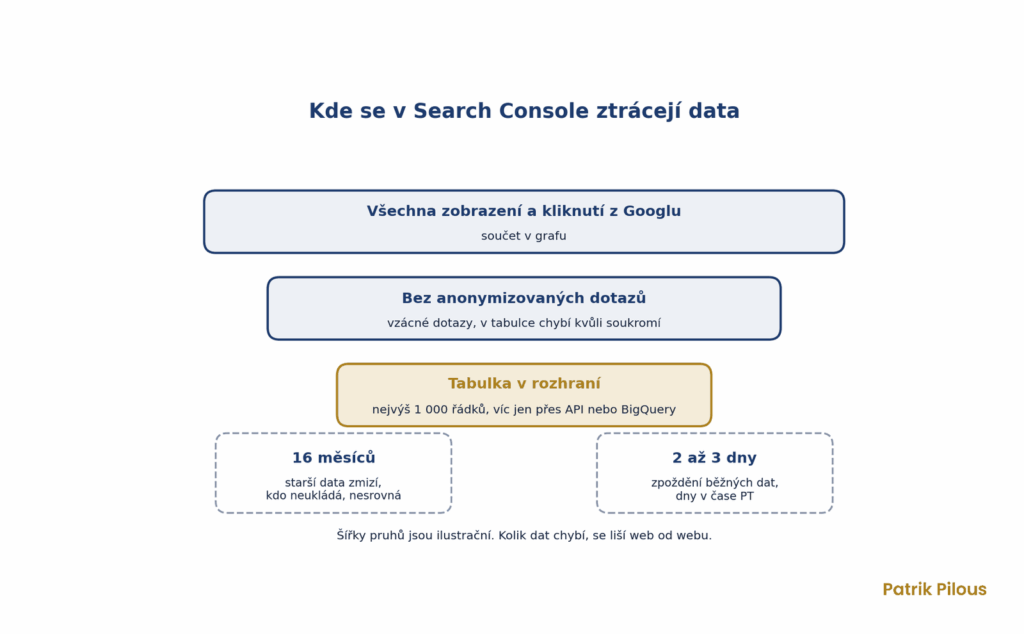
Anonymised queries are those that no more than a few dozen people search for over two to three months. Google hides them from the table for privacy reasons, but they are included in the chart total. For websites with a long tail of specific queries, they make up a substantial share of clicks that you will never see broken down.
The table in the interface shows and exports a maximum of 1,000 rows. The API allows 50,000 rows per day per website and search type, with 25,000 per request. Only the bulk export to BigQuery, which Google launched in February 2023, gives you complete data without a row limit. Even that, however, does not include anonymised queries.
The history goes back 16 months, and anything older disappears. If you don’t store the data yourself, you will have nothing to compare against in two years. Standard data appears with a delay of two to three days, and days are counted in Pacific Time, so the figures never fully match Google Analytics 4. The 24-hour view shows fresher numbers, but they are preliminary.
Average position is an average, not a location. In the chart, it refers to the website’s highest result; in the table, it is the average for the given row. On top of that, an AI Overview counts as a single position, and all links within it receive the same number. If your position improves and clicks drop, one possible explanation is an AI answer above the results. Before you draw a conclusion, check the query directly in the search results and rule out seasonality.
Connecting to Ahrefs and Marketing Miner via API
The interface is fine for a quick look. For client work, I use GSC data connected via API to Ahrefs and Marketing Miner. The reasons are practical: it gets me around the 1,000-row limit and brings the data into tools where I combine it with search volume and competitor data.
Once connected, Ahrefs loads up to 16 months of past data and then keeps storing it for as long as the account remains connected. After two years, I therefore have a longer history than Search Console itself offers. Ahrefs also matches GSC queries against its own query database, which partly reveals what is hidden among the anonymised queries. I explain why I use these particular tools in my overview of SEO tools.
In Marketing Miner, I mainly take queries within reach of page one from GSC, along with pairs of pages that compete with each other. I get search volume for them straight away, so I don’t sort by impressions but by how many people actually search for the query. I never add measured Search Console data and tool estimates together into a single number, though. One is a fact about my website, the other is a market estimate.
Most common mistakes
Most mistakes don’t happen in the tool but in how the numbers are interpreted. These are the ones I see most often with new clients, frequently even at companies that have had Search Console set up for years.
- A URL prefix property set up only for the https and www address, while the website also runs without www or on a subdomain. Part of the data is then missing from the reports entirely.
- An agency as the only verified owner. When the partnership ends, the company loses access to its own data. The client should always be the owner; a full user is enough for a supplier.
- Adding up the table rows and comparing them with the chart. It never matches because of anonymised queries and the 1,000-row limit.
- Judging success by the average position of the whole website. Adding new pages with lower positions worsens the average, even when traffic is growing.
- Internal links with UTM parameters. Each one creates a new URL for Google, and duplicates nobody created start piling up in Indexing.
- A sitemap full of redirected or non-indexable URLs. Google then reports a gap between submitted and indexed pages that is just noise.
- Panicking over the Indexing report. The status “Crawled – currently not indexed” is usually fine for pages with parameters or pagination, but not for categories and products.
Many mistakes only show up after the website changes. When you change page URLs, watch the Indexing report and pages with 404 errors in Search Console for weeks after launch. Old URLs without 301 redirects usually appear there as the first signal, giving you time to add them.
Search Console is part of every SEO audit, and it is the first thing I open, even before crawling the website. It shows where Google already sees a problem and saves hours of searching in places Google doesn’t care about. If you are opening it for the first time today, start like this. Check that your company is the owner, look at Manual actions, compare Indexing with the number of pages on your website, and only then look for queries in positions 5 to 15.
Questions about Google Search Console
The questions my clients most often send me about Search Console, with short answers. You will find the details in the sections above.
Is Google Search Console free?
Yes, the whole tool and its API are free. Only the bulk export to BigQuery costs money, and you pay for storage and queries in Google Cloud, not for Search Console.
How do I log in to Google Search Console?
Go to search.google.com/search-console and use a regular Google account. The account must be an owner or user of the property; otherwise, you won’t see any data and can only add and verify a new website.
How do I add a website to Search Console?
Choose Add property, select a Domain property or URL prefix, and verify ownership. A Domain property is verified with a TXT record in DNS; a URL prefix with an HTML file, a meta tag, or via Google Analytics or Google Tag Manager.
What is the difference between Search Console and Google Analytics 4?
Search Console shows what happens in Google’s results before the click, meaning impressions, positions, queries and click-through rate. Google Analytics 4 measures what visitors do after arriving on the website. You need both, and the click figures will never match exactly between them.
How long does it take for data to appear in Search Console?
For a newly added property, the first numbers usually appear within a few days; for a brand-new website, it can take up to a week. Standard daily data then arrives with a delay of two to three days, and only the last 24 hours view is fresher and preliminary.
What does the abbreviation GSC stand for?
GSC stands for Google Search Console. The tool used to be called Google Webmaster Tools, which is why you will occasionally still hear the older abbreviation GWT in the industry.

