
An attribution model is the rule your analytics uses to split the credit for an order between the channels the customer came through on the way to buying. One model gives everything to the last click, another to the first, others split the order equally or according to the data. For a company, this has an awkward consequence. Depending on the model you choose, you can credit the same revenue to completely different channels, and anyone who allocates budget by a single model can easily get it wrong.
Attribution only answers the question of which route the customer took. It does not tell you whether they would have bought without the ads. That is what incrementality tests and marketing mix modelling are for.
Why every channel reports more conversions than you have orders
Google Ads, Meta, Sklik (the ad platform of Seznam, the Czech search engine) and Heureka (Czech price comparison site) all measure conversions with their own code, and each one claims an order according to its own rules and time windows. None of them checks whether someone else has already claimed the same order.
Meta also counts purchases by people who only saw an ad and did not click (according to guides by specialist Jon Loomer, the default window is 7 days after a click and 1 day after a view). GA4 will never see these view-through conversions, because it only measures website visits.
An illustrative scenario. An online shop has 100 orders in a month. Google Ads reports 70 conversions, Meta 45, Sklik 20 and Heureka 15. That makes 150 conversions in total, half as many again as there are real orders. Each vendor will show you its own report, and each will be right by its own rules.
The number of real orders is held by the online shop’s system (minus cancellations and returns). The second best view comes from GA4, because it splits each order between traffic sources only once. According to its help pages, direct visits get no credit unless the whole path was direct. That is why the numbers you use for budget decisions should not come from the ad platforms. More on this in the article on ROAS and PNO.
Which attribution models exist and what is left of them
Rule-based models assign credit by a fixed key. Data-driven attribution learns the key from the data of a specific account. It compares paths that ended in a purchase with paths that did not, and according to the Google Analytics help pages it is built on a counterfactual approach, comparing what happened with what could have happened. It is still a model of observed paths, though, not a controlled experiment.
| Model | Who gets the credit | When to use it | Weakness |
|---|---|---|---|
| Last click | the whole order to the last channel | a quick check of performance campaigns | overvalues brand search and remarketing |
| First click | the whole order to the first channel | when you want to know where people first hear about the company | ignores everything that persuaded the customer |
| Linear | all channels equally | longer paths where you want to see every touchpoint | cannot tell a strong touchpoint from a random one |
| Time decay | more to channels closer to the purchase | short promotions and sales | undervalues the channels that created the demand |
| Position-based | 40% to the first and last, the rest to the middle | when you value both discovery and closing | the 40/20/40 split is arbitrary |
| Data-driven | based on the account’s data | the default in GA4 and in Google Ads | a black box, sees only measured touchpoints |
Of this table, only two rows are left in Google Ads today: data-driven and last click. In its attribution reports, GA4 also offers a version of last click limited to Google paid channels. On 6 April 2023, Google announced that the first click, linear, time decay and position-based models were ending in both Google Ads and GA4. In Google Ads, they could not be selected for new conversion actions from June 2023, and from September 2023 Google switched the remaining actions to data-driven.
According to the help pages, they have not been available in GA4 since November 2023. Google justified the change by saying that the four retired models were used by fewer than 3% of web conversions in Google Ads (based on its data for February and March 2023).
Rule-based models are still worth knowing, because they show how much the result depends on the rule someone chose.
One 3,000 CZK (about 120 EUR) order under five models
An illustrative scenario. A customer first sees an online shop in an Instagram ad and clicks. Eight days later, they find a how-to article through Google. Three days after that, they open a newsletter. Two days later, they type the shop’s name into Google, click on a brand ad and buy for 3,000 CZK (about 120 EUR).
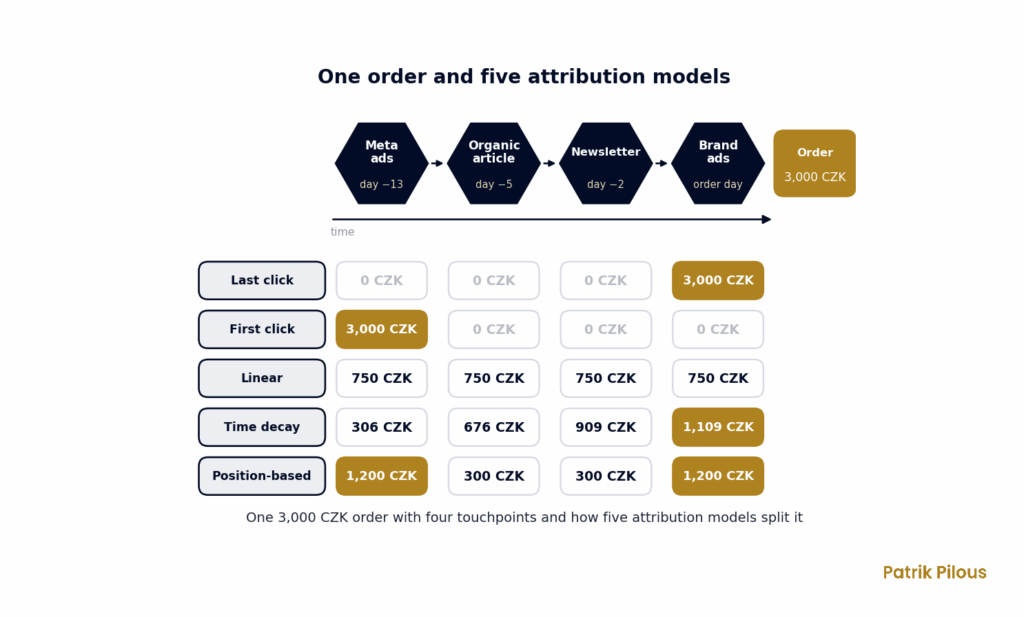
| Touchpoint (days before purchase) | Last click | First click | Linear | Time decay | Position-based |
|---|---|---|---|---|---|
| Meta ad (13) | 0 CZK (about 0 EUR) | 3,000 CZK (about 120 EUR) | 750 CZK (about 31 EUR) | 306 CZK (about 13 EUR) | 1,200 CZK (about 49 EUR) |
| Article from Google (5) | 0 CZK (about 0 EUR) | 0 CZK (about 0 EUR) | 750 CZK (about 31 EUR) | 676 CZK (about 28 EUR) | 300 CZK (about 12 EUR) |
| Newsletter (2) | 0 CZK (about 0 EUR) | 0 CZK (about 0 EUR) | 750 CZK (about 31 EUR) | 909 CZK (about 37 EUR) | 300 CZK (about 12 EUR) |
| Brand ad in Google Ads (0) | 3,000 CZK (about 120 EUR) | 0 CZK (about 0 EUR) | 750 CZK (about 31 EUR) | 1,109 CZK (about 46 EUR) | 1,200 CZK (about 49 EUR) |
The calculation is for illustration only. I calculated time decay with a 7-day half-life, which Google used as the default in the old Universal Analytics. A touchpoint a week old gets half the weight of a touchpoint on the day of purchase, and one two weeks old gets a quarter. In the position-based model, the first and last touchpoints get 40% each and the two in the middle share the remaining 20%.
The difference is huge. Under one model, the Meta ad gets nothing, and under another it gets the whole order. Anyone judging Meta only by last click might switch it off, while by first click they would give it more. Data-driven attribution would produce some fourth number that cannot be calculated by hand, because it depends on how thousands of other paths in your account behave.
Why attribution does not measure what ads actually brought in
Attribution splits up orders that happened. It cannot tell you how many of them would have happened without the ads. This question is called incrementality, and for your budget it matters more than any model.
The best-known evidence comes from eBay. A team of economists led by Steven Tadelis of Berkeley showed in randomised experiments that ads on brand keywords have no measurable short-term benefit, because people searching for eBay click on the organic result instead (Consumer Heterogeneity and Paid Search Effectiveness, Econometrica, 2015).
For non-brand keywords, the ads did work on new and infrequent customers, but most of the budget was spent on loyal customers who would have bought anyway.
A comparison of methods at Facebook turned out similarly. Brett Gordon and colleagues compared 15 large experiments with the results of observational methods, which work with commonly available data, and the observational methods often missed the true effect of the advertising (A Comparison of Approaches to Advertising Measurement, Marketing Science, 2019).
A newer paper by the same team, based on 2,226 Meta experiments, reports that standard 7-day click attribution explains only a small part of the differences in incremental conversions per dollar, with a coefficient of determination of 0.19 (Predicted Incrementality by Experimentation, working paper, 2023, revised 2026).
“Attribution does not take into account whether the sale would have happened without the marketing.”
Ana Carreira Vidal et al., Modern Measurement Playbook, Think with Google, 2024
Google says this itself. In an example from the playbook, a customer clicks on an ad, leaves, then a friend recommends the purchase and they come back. Attribution credits the sale to the ad because it came before the purchase, even though the recommendation was decisive. A channel that collects customers who have already decided therefore looks great in attribution, and the more you give it, the better it keeps looking. (In my view, this is the most common hole in budgets, and no report will show it on its own. It is related to what Goodhart’s law describes.)
Three levels of measurement by company size
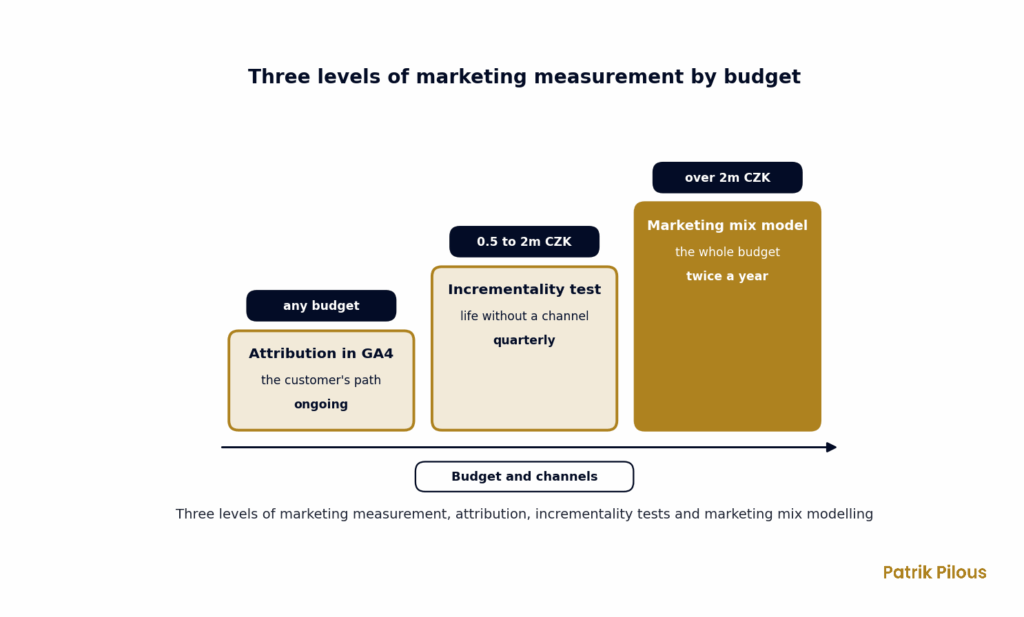
Each level of measurement answers a different question. Attribution tells you which routes customers take. An incrementality test tells you what would happen without a specific channel. Marketing mix modelling estimates how the whole budget and external factors, such as seasonality or prices, affect revenue. In the playbook, Google advises monitoring attribution continuously. It recommends experiments roughly every quarter and MMM twice a year.
Attribution in GA4 as the foundation for everyone
Every company that spends money on advertising should have the basics in place: a clean GA4 setup with purchases configured, cookie consent connected correctly, tagged campaigns and one report that compares GA4 revenue with revenue from the online shop’s system. According to the help pages, the default window in GA4 is 90 days for standard conversions and 30 days for the acquisition events first_visit and first_open, and both can be changed. The gap between GA4 and your accounts tells you how many orders your analytics does not see at all.
Incrementality tests
A conversion lift test at Meta randomly splits the audience into a group that sees the ads and a control group that does not. According to Meta’s documentation, the difference in conversions between the two groups is then calculated.
A geo test works in a similar way, except that you split regions instead of people. Jon Vaver and Jim Koehler of Google described how non-overlapping regions are randomly split into test and control groups (Measuring Ad Effectiveness Using Geo Experiments, 2011).
For a Czech company, the cheapest option is to switch off a channel for four weeks in selected regions and compare revenue with comparable regions, or to pause brand campaigns for the same period and watch how many orders move to the organic results. Choose regions that are similar in size and in revenue trends, and bear in mind that with a small number of orders, noise can easily drown out the real difference, so without sufficient volume the result will prove nothing.
Marketing mix modelling
Marketing mix modelling works with aggregated weekly data: spend by channel, revenue, prices, seasonality and promotions. It needs no cookies and no data on individual people. Meta released the open source tool Robyn in November 2021, and Google made its Meridian available to everyone on 29 January 2025. Both can refine the model with the results of experiments.
Only the software is free, though. Meridian’s documentation recommends at least two years of weekly data for a regional model and three years for a national model, and the model has to be built and interpreted by someone who understands statistics. For a company with one channel and a stable budget, MMM usually reveals little, because the data lacks the fluctuations it would learn from.
| Monthly ad budget | What to measure | How often | What to watch out for |
|---|---|---|---|
| up to 100,000 CZK (about 4,100 EUR) | GA4 and comparison with online store revenue | every month | do not add up conversions from ad platforms |
| 100,000 to 500,000 CZK (about 4,100 to 21,000 EUR) | GA4 plus switching off brand campaigns as a test | a test once every six months | enough orders for the test to show something |
| 500,000 to 2 million CZK (about 21 billion to 82,000 EUR) | Meta conversion lift, geo tests by region | quarterly | always test only one change at a time |
| over 2 million CZK (about 82,000 EUR) and several channels including offline | MMM calibrated with experiments | twice a year | two to three years of clean data, a statistician on the team |
The thresholds in the table are indicative and based on my own reasoning, not on a study. What matters most is the number of orders and the number of channels; the budget is only a proxy for them.
Where attribution fails
Attribution sees only what tracking code on the website can measure. Whole parts of the customer journey escape it.
- Physical shops and offline. A purchase in a branch after viewing the website does not show up in GA4.
- Phone and email. A phone order has no source in analytics unless a salesperson matches it manually.
- Heureka and price comparison sites. Heureka (a Czech price comparison site) measures conversions with its own code, so it claims an order even when GA4 credits it to another channel.
- Cookies and consent. Since 1 January 2022, analytics and advertising cookies in the Czech Republic require prior consent (Section 89(3) of the Electronic Communications Act (zákon o elektronických komunikacích)). For people without consent, Google partly estimates conversions with a model, but nobody sees their actual journey.
- iOS and cross-app tracking. Since iOS 14.5, released on 26 April 2021, apps must ask users for permission to track, which mainly weakened ad measurement in Meta.
- Multiple devices. Someone sees an ad on their phone, buys on their work computer, and without logging in it does not look like one journey.
When is attribution enough? When you have one main channel, a short buying process and almost all orders online. Then the difference between models tends to be small and tests would cost more than they would save. For a company with branches, phone orders, a large share of sales through price comparison sites or a long B2B decision process, on the other hand, attribution shows only a small part of the truth.
What to ask an agency or a marketer
These five questions quickly show whether someone understands measurement or just forwards numbers from the interface.
| Question | What you want to hear | Warning sign |
|---|---|---|
| What source are the conversions in the report from? | from GA4 or the online store, with an explanation of the difference | only from Google Ads or Meta |
| Does the sum of conversions across all channels match the number of orders? | no, and here is why and by how much | “you can’t compare that” |
| Which attribution model do you use and why? | a specific model and what it favours | doesn’t know, or “the default” |
| How much revenue would remain if we switched off brand campaigns? | a proposed test with a control group | “everything would collapse”, with no data |
| When did you last test incrementality? | date, setup, result | never, and no plans to |
The fourth question tends to be the most sensitive, because brand campaigns usually have the best ROAS in the whole account. All the more reason to test them. I describe which other metrics are worth asking suppliers for in the article Marketing and KPIs.
Who in the company should own measurement
A specialist sets up attribution, an analyst designs the incrementality test. But deciding which numbers the company trusts and what the budget is shifted by must be done by someone who owns none of the channels. Otherwise the PPC agency judges PPC and the social media manager judges social media, each with their own model.
In a larger company this is the marketing director. In a smaller one nobody often holds this role, or the owner holds it in the evenings after work. That is why a single version of the numbers is the first thing I set up in a company as an outsourced CMO, even before any budget changes. I cover what else the role involves in the article who a CMO is and what they do in a company, and how measurement turns into a plan on the page marketing strategy.
Interesting questions on the topic
Which attribution model should you set in GA4?
Data-driven, if you have enough conversions and no strong reason for another. Last click is useful as a control view.
Why do conversions differ between GA4 and Google Ads?
Each tool sees a different part of the journey. Google Ads splits credit mainly among Google ads, while GA4 also includes organic results, email and other sources. The windows and the handling of people who declined cookies differ too.
What is incrementality in marketing?
The number of orders or the revenue that would not have happened without a given ad. It is measured with a test using a control group that does not see the ad.
Is marketing mix modelling only for large companies?
The software is free, but the model needs two to three years of weekly data and several channels between which the budget shifts. For a smaller online store with one main channel, a simple geo test makes more sense.
Can you trust attribution?
As a map of the customer journey, yes. As proof that advertising created the revenue, not without an incrementality test.
Euro amounts are approximate, converted at the Czech National Bank rate of 24.34 CZK per EUR on 29 October 2026.

